Investing in SEO strategy can increase both conversions and revenue. However, the only way to understand the results of your efforts is to track the numbers.
It starts by learning to measure and evaluate your analytics, and only then can you determine whether your strategy is working. Furthermore, you’ll understand the areas you should focus on improving next!
The correct metrics are right there within Google Analytics. Are you ready to crack down on the right numbers to track the success of your SEO strategy? Let’s get started!

Understanding the Metrics of SEO
Business SEO is all about establishing authority and boosting traffic. The goal is to drive targeted visitors. This provides higher numbers to work with, boosting chances for conversions.
[Tweet “A solid SEO strategy improves web traffic and sends quality leads.”]
How can you determine whether this is happening? The answer is in the traffic.
Metric 1: Sessions and Unique Visitors
First things first—what is a session?
A session is the collective actions of a user during a set period of time on your site. It begins when they arrive, and ends when they leave completely. The session also ends if they remain inactive on your site for 30 minutes.
Google tracks page views, interactions, events, and transactions within the period of their session. You can read the official details here.
One person can have many sessions on your site within one reporting period. It’s important to note that sessions do not represent how many individual users accessed your site! To view the unique visitors, find the Users metric.
Let’s take a look in Google Analytics. To narrow down your search, change the left hand corner dropdown labeled All Users to Organic Traffic:

Now, click on Audience > Overview:
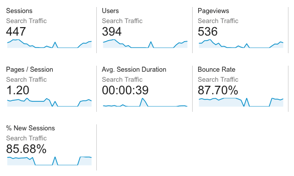
You can now access the relevant data for your site, including most of the metrics listed in this guide. Right now, you’re looking at Sessions and Users.
What to Look For
The rise and fall of your sessions and users shows whether your traffic is improving, and by how much.
A good SEO strategy increases sessions coming through general organic search, and specific, targeted keywords. So, how can you tell whether the traffic coming to your page is any good? The answer is by looking at the bounce rate.
Metric 2: Bounce Rate
Unfortunately, bounce rates are nowhere near as fun as trampolines.
Think about the last time you were on a trampoline. You didn’t stay in contact with it long, did you? You touched down, then bounced away to another spot. The same goes for visitors on your website. The bounce rate is the number of visitors leaving from the page they entered, without interaction.

A high bounce rate means many users leave immediately. Many factors can contribute to high bounce rates, and not all are bad. For the most part, however, the lower the better.
Your bounce rate provides measurement for your traffic quality. It shows whether users engage beyond a cursory skim.
Bounce rates can help to:
- Identify topics resonating with your visitors. Data helps you isolate topics with the lowest bounce rates.
- Narrow down topics not engaging well (i.e. those with a high bounce rate). In the end, you may save effort in the future by moving away from this kind of content.
What to Look For
You want bounce rates to decrease over time. Meanwhile, focus on strengthening pages losing the most visitors.
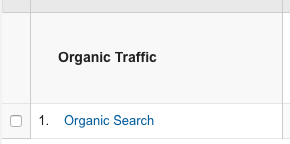
Let’s try and identify which content performs the best, according to bounce rates. In Google Analytics, navigate to Acquisition > All Traffic > Channels, and choose Organic Search from the table below:
Feed your desired keyword into the data table as shown. Follow this tutorial to group similar keywords together:
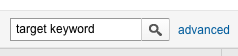
The data table will now display the bounce rate for that search. Repeat with each keyword, and compare the results.
With these reports, you’ll know which content performs well, and which needs help. Here’s how to improve the bounce rate on low performance pages.
Metric 3: Pages Per Visit
How many pages did a user click before leaving your site? The answer to this, averaged by all users on your site, determines the Pages Per Visit metric. This means the decimal point does not represent anyone viewing 0.14 of a page before leaving.
This metric shows how sticky your content is, and yes, it sounds gross if you don’t know what that means!
Sticky content is designed to keep users coming back, and generally hold them on the site longer. You know, like those posts you publish for content marketing.
What to Look For
Pages per visit also rates your SEO traffic quality.
It helps to:
- Identify topics leading to higher pages per visit, so you can produce more.
- Improve the stickiness, fixing up underperforming keywords.
Here’s exactly how to improve your pages per visit.
Bonus Metric: Time Spent Per Visit

Time Spent Per Visit is the average time a user spends per session.
Action points (such as the shopping cart) shouldn’t take long to use, but your SEO content should take time to read and absorb. It goes to say, expectations change for different content types. Tutorials are more likely to see long visits than news articles, for example.
What to Look For
Time per visit can gauge how invested users are. It seems time works best to give the other metrics context.
Your brand should aim for one of these two categories:
- High time on site, high number of page views. These statistics show high interest and interaction with your site. Keep putting out similar content, and ensure your design provides a quality user experience.
- High time on site, low number of page views. Your page views aren’t increasing the way you expected. It may mean users spend plenty of time ingesting your content, without the time to click through to more pages.
It’s valuable to increase time spent, as it generally means high user satisfaction. Here’s a useful read to put this metric into perspective.
How to Track Targeted Improvement
Use a monthly spreadsheet to watch how your targeted SEO strategies progress. Across the top, use these labels:
- Keyword
- Date Introduced
- Monthly Sessions
- Monthly Users
- Bounce Rate
- Pages Per Visit
- Time Per Visit
- Landing Page #1
- Landing Page #2
Once a month, you’ll collect all the metrics from above for each of your target keywords. To collect the top landing pages for each keyword, start by following the same steps you used to get the bounce rate for a keyword group.
Next, add Landing Page as a secondary dimension to see where the traffic goes, and grab your landing pages:

Your final report will look something like this:

Conclusion
Your SEO strategy shouldn’t be a guessing game. When you track the right metrics, it becomes clear whether it’s making the right impact.
The important metrics to watch are:
- Sessions and unique visitors
- Bounce rate
- Pages viewed
- Time spent on your site
Over time, these metrics provide a clear image of how well your SEO strategy is performing.
What metrics do you find most valuable when tracking the impact of your SEO strategy, and which metrics are the most confusing? Ask us your questions in the comments section below, so we can help you to understand how each of these metrics applies to you!